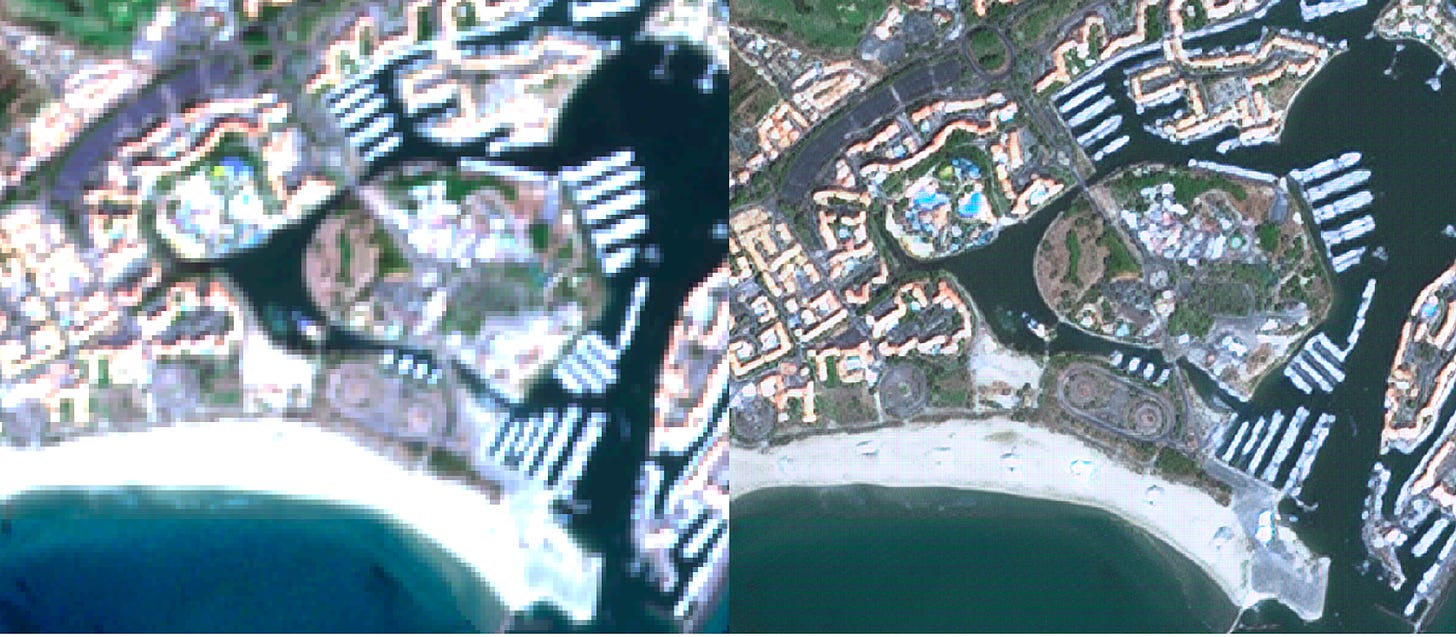
How accurate are super-resolution models?
Everything you need to know about increasing the resolution of satellite data
I first became interested in techniques to increase the resolution of satellite images through my work with the World Bank.
We’d worked with governments in Eastern Europe and Asia, and I was blown away by their technical capabilities.
I remember government agencies showing us some pretty sophisticated computer vision models they’d developed to identify buildings from high-resolution satellite imagery.
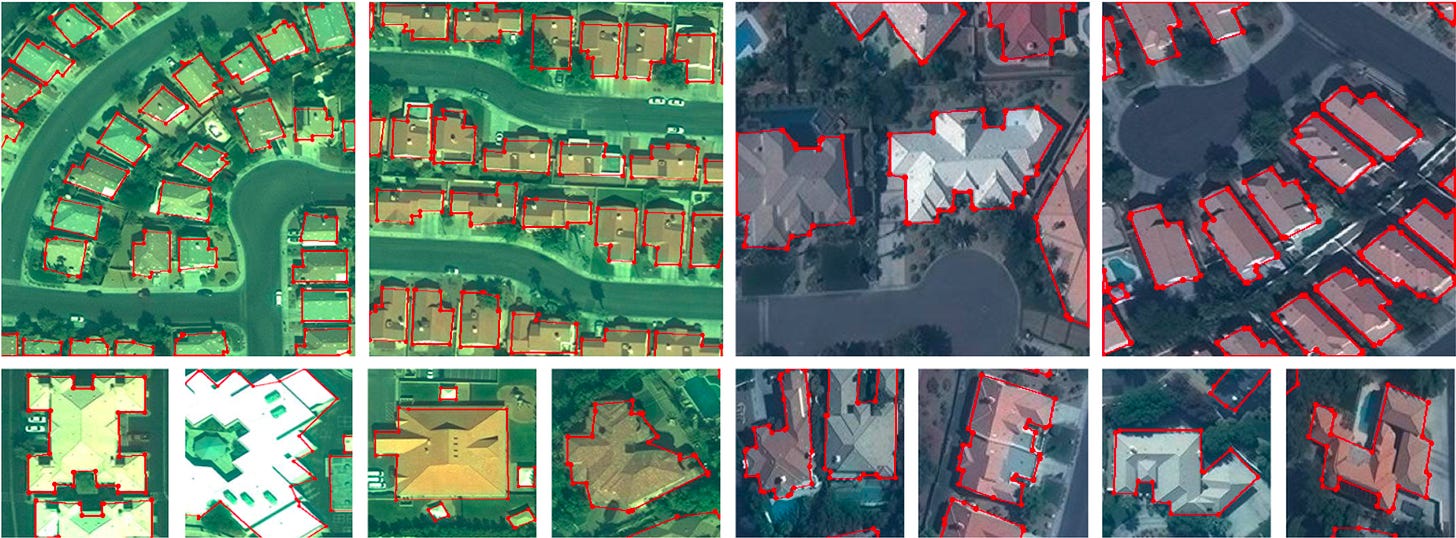
They could use these models to understand if a building (which they detected from a satellite) was missing from the cadaster. They could also use these models to detect things like illegal construction (e.g. buildings in areas not zoned for residential property).
But the big problem they faced was the cost of purchasing high-resolution data.
Very high-resolution images (e.g. 50cm resolution) can cost about $7 per km2. This means that for a country the size of the UK, one day of data would cost about $1.7 million(!).
So these government agencies had one random day of data from 2018, another day of data from 2021 from a completely different provider, and so on. It was a mess.
The natural question to ask is are there any low-cost alternatives?
This is where super-resolution comes in.
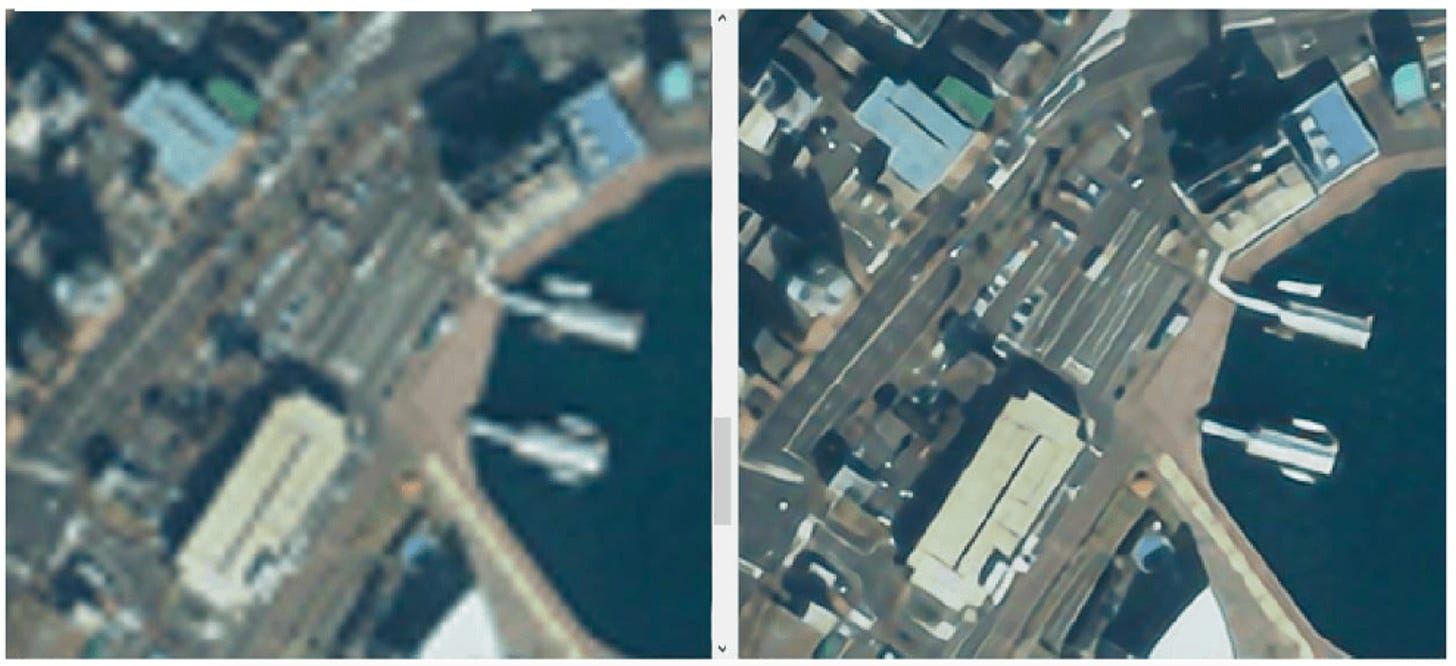
In theory, you can take free satellite data like Sentinel-2 and, using AI, increase the resolution of the image from 10 metres to 2.5 metres, or even 1 metre.
Of course, this sounds too good to be true. And it also opens up a bunch of questions:
How does it work?
How accurate is it?
Is this related to generative AI?
Is it better for some areas than in others (e.g. urban areas vs rural areas)?
These are the questions I attempt to answer in this newsletter.
The bottom line is as follows:
there are many different approaches to super-resolution (some better than others)
super-resolution is NOT a panacea. Super-resolved images are better for some use cases than others
the quality of the inputs is the most important factor
Depending on what your goals are with super-resolved images, they can be an excellent first step in an analysis. They can serve as an interim measure before investing significant sums of money in buying high-resolution images.
What is super-resolution?
Super-resolution is the process of enhancing the resolution of images — typically through AI.
There’s been a proliferation of no-code image upscaling tools released in the last year, capitalising on the AI renaissance.
These have been responsible for catapulting super-resolution into the mainstream.
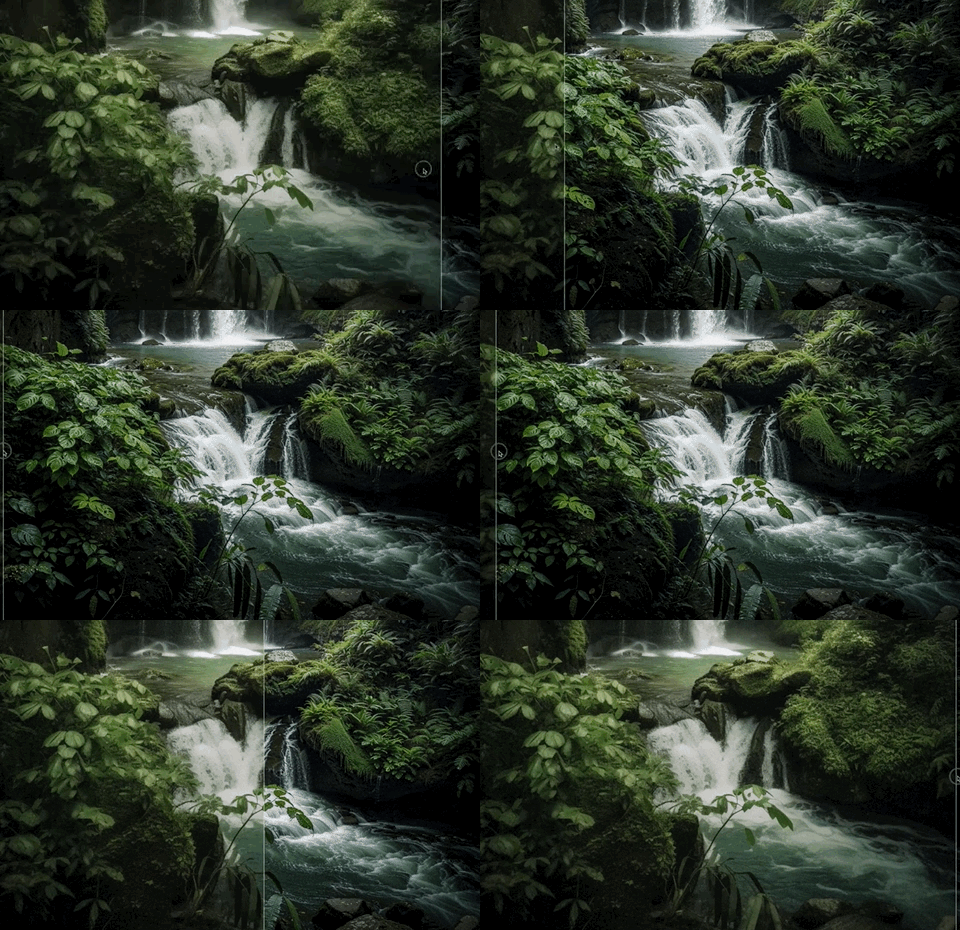
Companies like Magnific, have been getting a lot of attention. You can take a low-resolution image (even one that you’ve generated using Midjourney or Dall-E), upload it to their platform, and then easily increase its resolution with just a few clicks:
Tools like Magnific impute details that weren’t in the image before. Most of the time—particularly for artistic purposes—we don’t really care if these new details aren’t 100% accurate. Instead, we care about sharpness and detail.
For example, take a look at this image before and after upscaling:


We can see that in the upscaled image, the woman has blue eyes (whereas before she had green). The lips are a different colour and the nose shape is slightly different.
But this isn’t really an issue if we’re just interested in generating a more detailed photo.
This is a problem if we care about satellite images though.
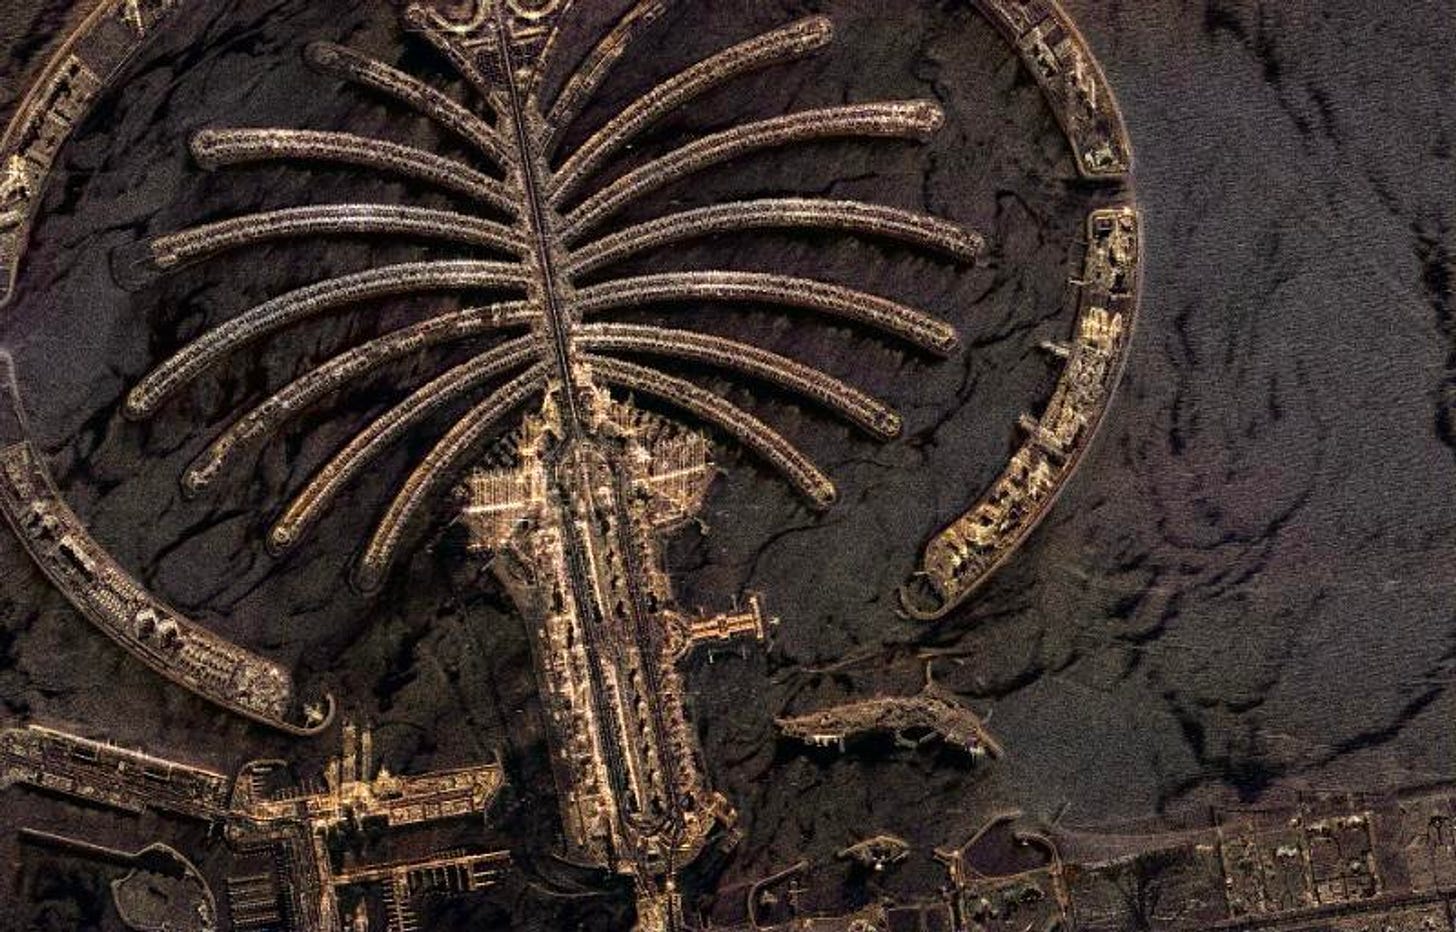
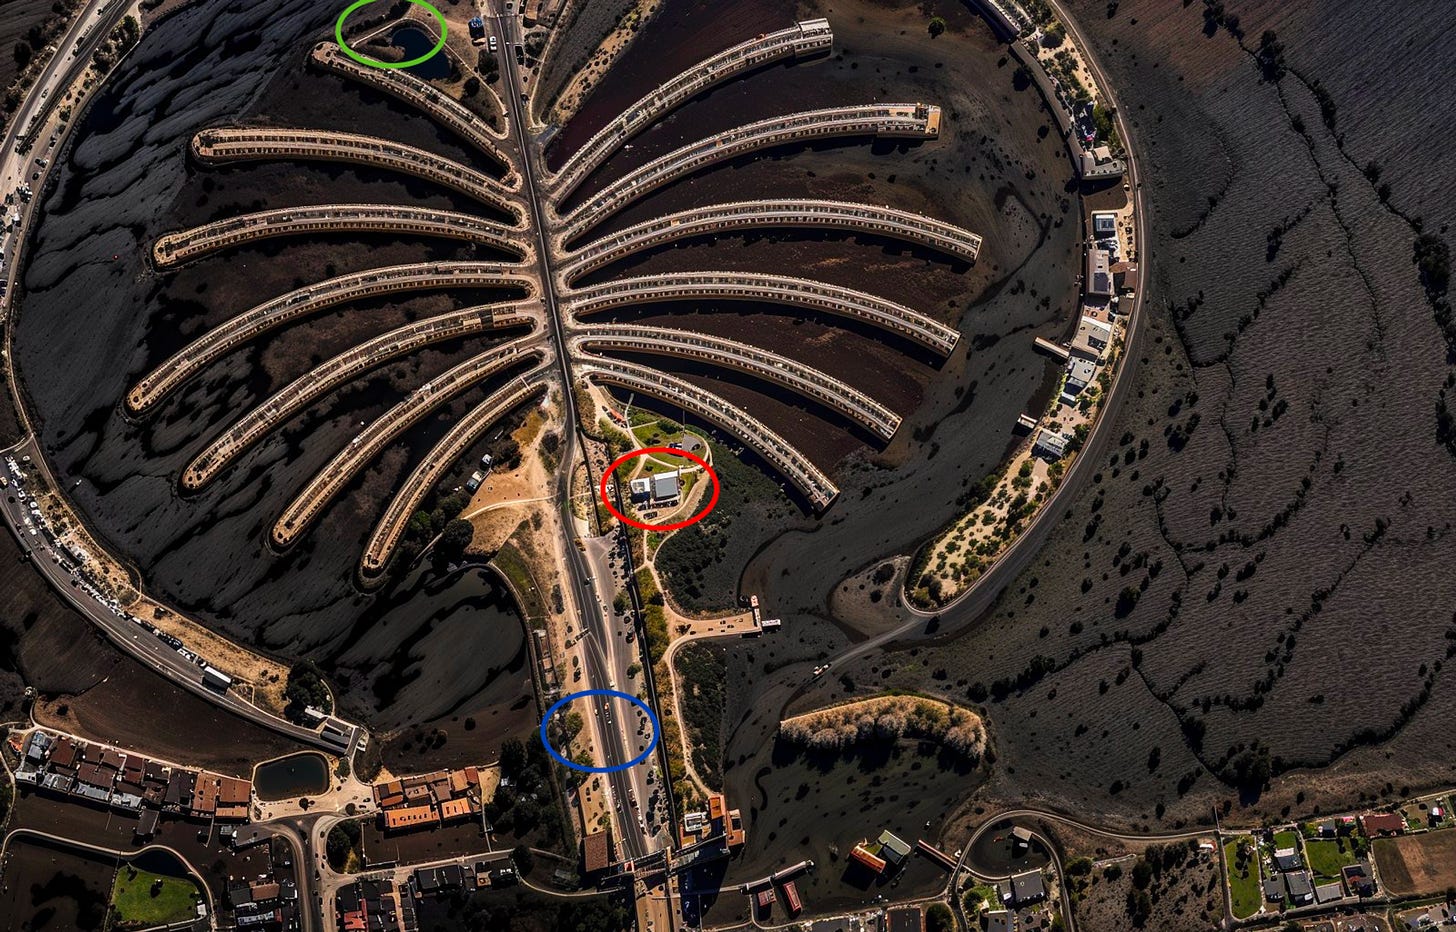
Let’s take a look at how Magnific performs when upscaling satellite images:
The bottom image has a significantly higher resolution than the first image. But in doing so, it’s just made up a number of details that weren’t there in the first image. For instance, we see trees in the ocean, a rooftop (circled in red), a new road (circled in green), and some cars (circled in blue).
These made-up elements (i.e. ‘hallucinations’ or ‘artefacts’) are a problem when it comes to satellite data.
When we use satellite imagery, we’re not just interested in a pretty picture. We want to be able to do some type of analysis. And you can’t do any meaningful analysis with a bunch of made-up information.
Now it’s not really fair to use a tool like Magnific—which is trained on non-satellite images and is made for artists and designers to use—for upscaling satellite images.
But this little experiment nonetheless leads us to the million-dollar question: how accurate can super-resolution models be for satellite images?
To answer this question, we need a basic understanding of how super-resolution works.
This is because there are many different factors that influence the quality of super-resolution. And there are also many different methods of super-resolving satellite images.
How accurate is super-resolution for satellite images?
This is the most common question I get asked when I speak about super-resolution. And, unfortunately, it’s not so easy as saying “very accurate”, or “not so accurate”.
What we can say is that the accuracy of super-resolution models depends on a few key factors:
Data inputs
Model selection
Model calibration
Let’s take a look at each.
Data inputs
At the end of the day, the quality of super-resolution images depends on the quality of the training data.
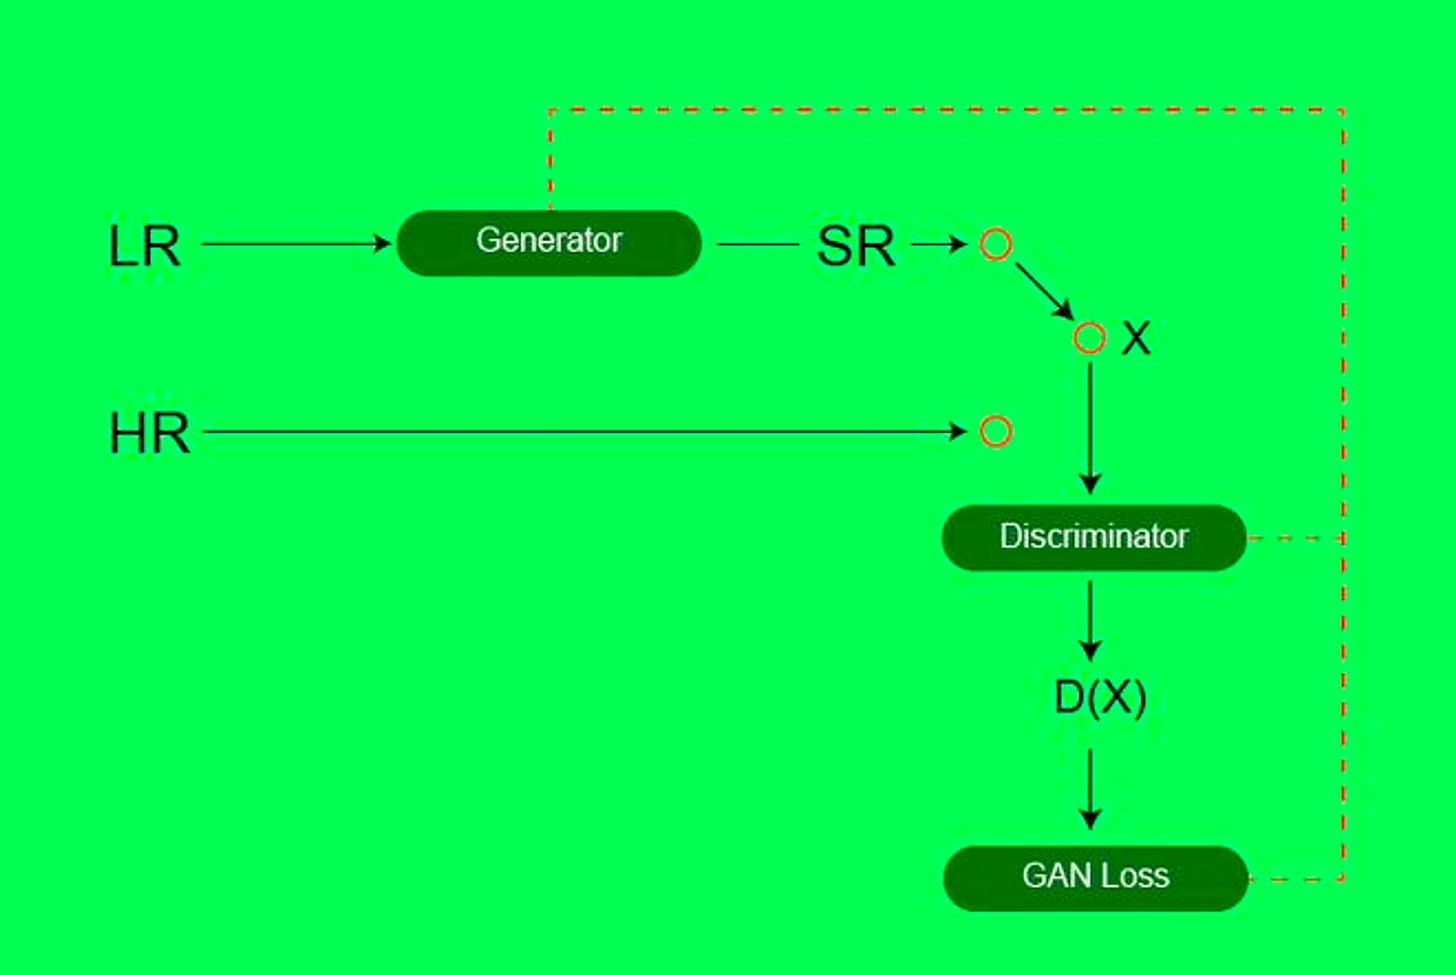
For many approaches to super-resolution, we need to pair a low-resolution image (such as from Sentinel-2), with a high-resolution image (such as from WorldView). We then train a model on the relationship between these two images:
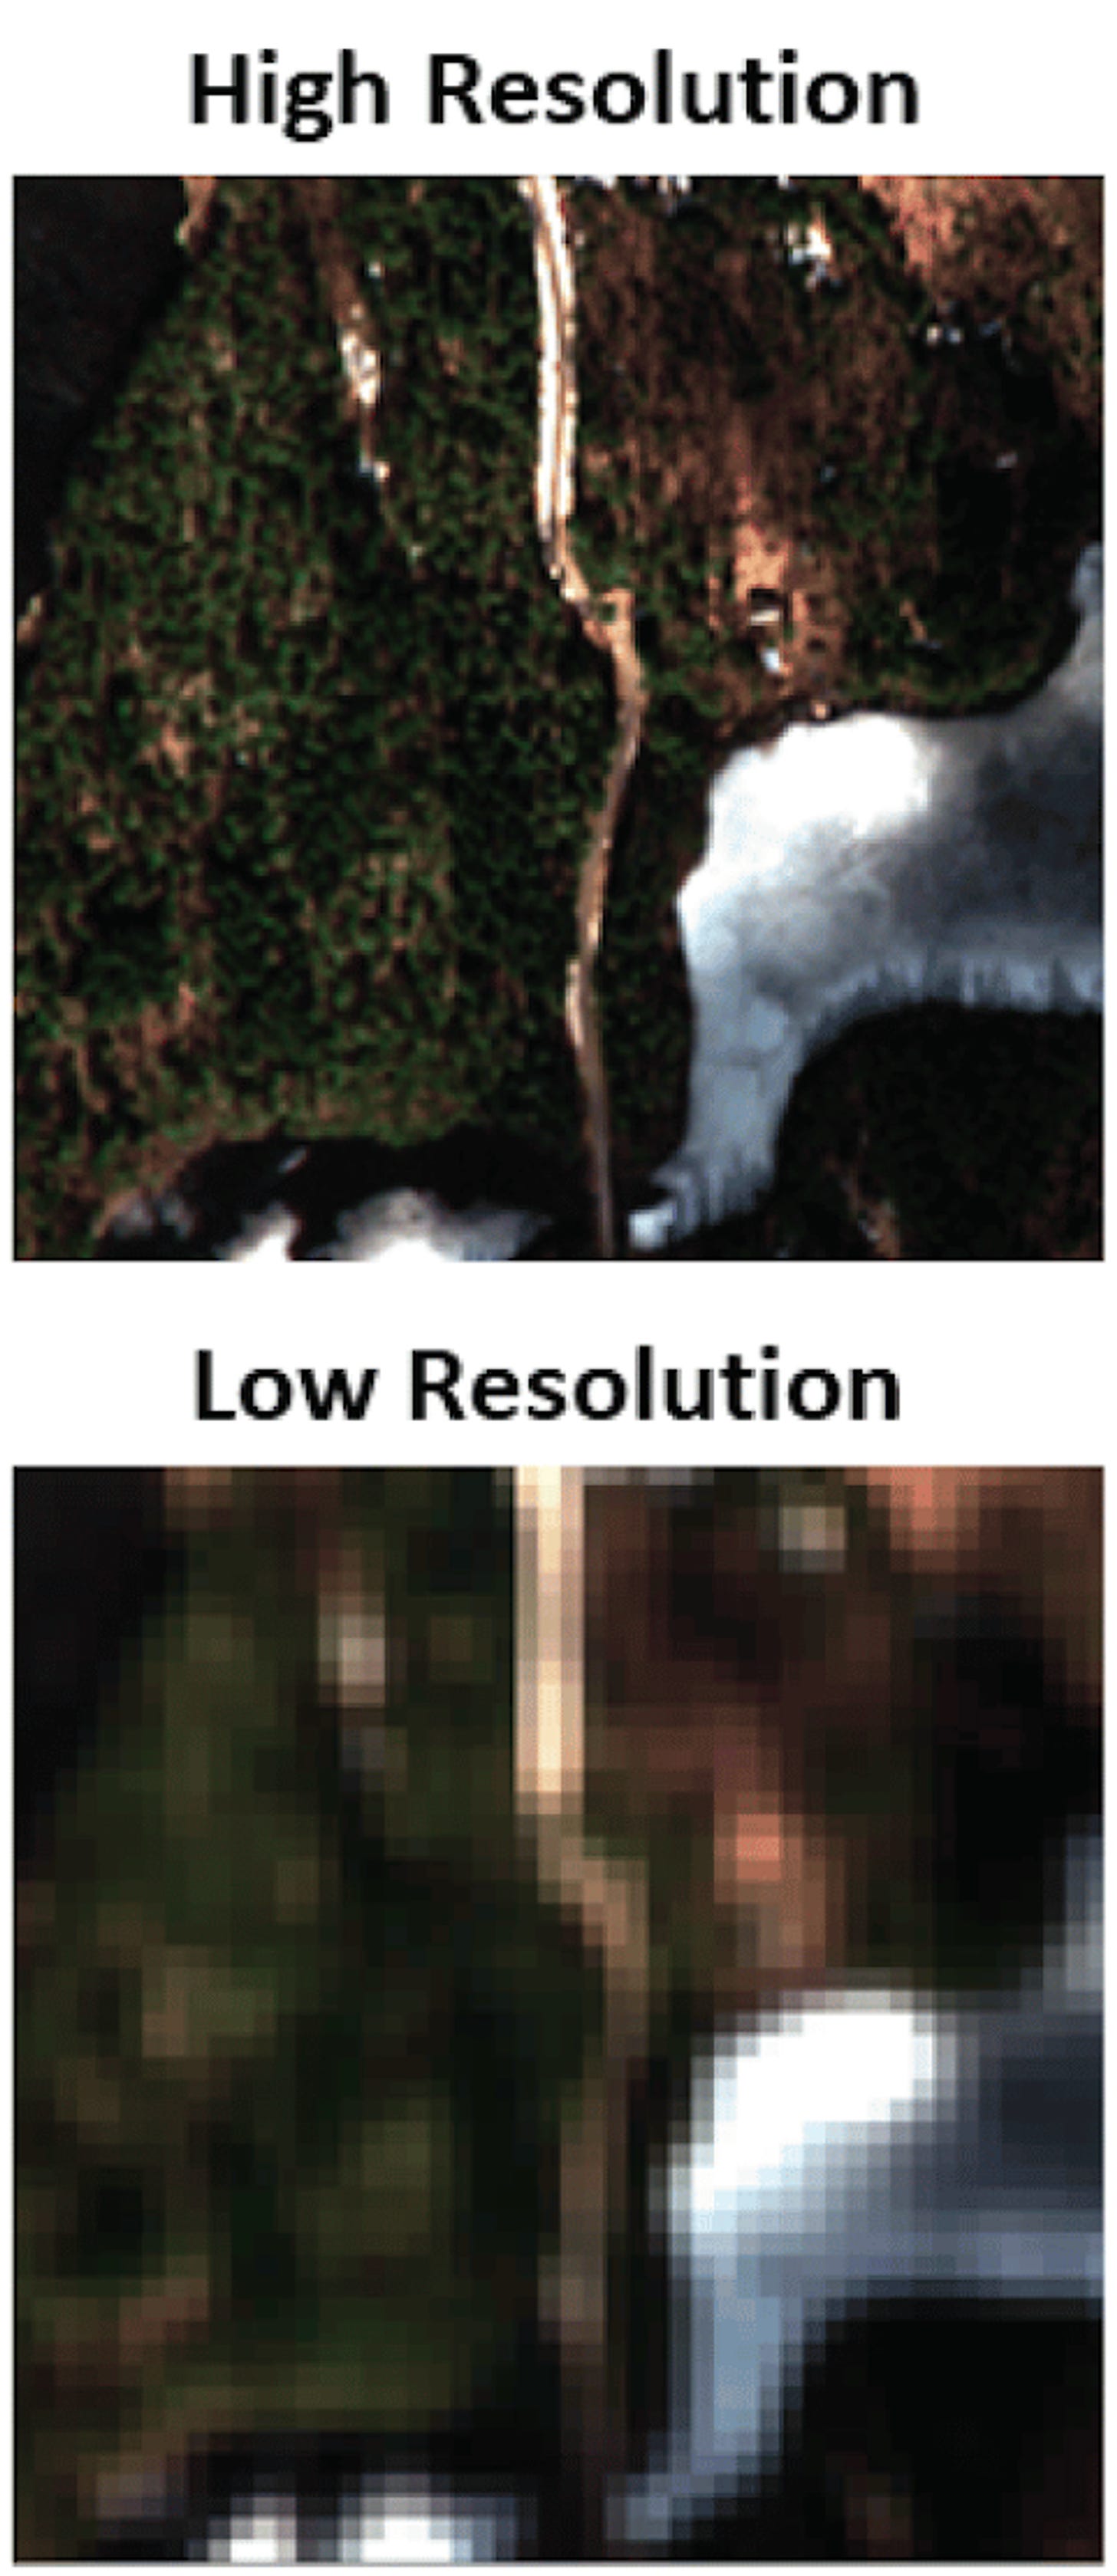
Using such a model we can then predict synthetic high-resolution (i.e. ‘super-resolved’) images, using freely available low-resolution images.
But if we only have 100km2 of high-resolution images, that’ll be a problem. Similarly, if we have high-resolution images that are obscured by clouds, that’ll also be a problem.
Finally, we need a good way of pairing the low and high resolution images. I.e. both images need to be taken of the same location and same date.
To summarise, we need good-quality input data. And good quality input data involves:
a large coverage of data
clean images that aren’t obfuscated by clouds or other factors
accurate pairing between low-res and high-res images
So you’re probably thinking that’s all well and good, but where can we get these high-resolution images?
Here’s a list of some of the free high-resolution datasets I could find, after spending countless hours going through the super-resolution literature:
National Agriculture Imagery Program (NAIP)
Details: Collects aerial footage of agricultural growth in the United States, covering 9 million km² each year.
Resolution: 1m
Planet SkySat
Details: Provides imagery from Google Earth Engine.
Resolution: 1m
Link: SKYSAT_GEN-A_PUBLIC_ORTHO_RGB, SKYSAT_GEN-A_PUBLIC_ORTHO_MULTISPECTRAL
Functional Map of the World
Details: Features over 1 million images from over 200 countries.
Resolution: Various
Link: fMoW Dataset
UC Merced Land Use Dataset
Details: 2,100 images
Resolution: 30cm
Link: UC Merced Dataset
Spacenet
Details: Covers 67,000 km² of imagery.
Resolution: Various
Link: Spacenet on AWS
AID Data
Details: Consists of 10,000 images from Google Earth.
Resolution: Various
Link: AID Dataset
WorldStrat
Details: Covers 10,000 km², from agriculture to ice caps, enriching locations typically under-represented in ML datasets with temporally-matched high-resolution and low-resolution Sentinel-2 images.
Resolution: High-resolution matched with 10 m/pixel Sentinel-2 images
Link: WorldStrat
WHU-RS19
Details: A collection of high-resolution satellite images up to 0.5 m from Google Earth, covering 19 classes of meaningful scenes with about 50 samples each.
Resolution: Up to 0.5 m
Link: WHU-RS19
ESA’s SkySat Archive
Details: ESA collates sample SkySat data from Planet.
Resolution: 0.5m
Link: ESA EO Gateway
Model architecture
There are actually many different models used to super-resolve images. And it’s a constant battle for researchers to find out which one performs best.
Let’s have a quick overview of some of the most commonly used models:
1. Pansharpening
OK so pansharpening technically isn’t a super-resolution model, but rather an approach to super-resolution. You can pansharpen using a few different models.
But in any case, it’s the most simple method of super-resolving images. It doesn’t use any type of AI, and you can do it pretty easily using tools like Google Earth Engine, ArcMap or QGIS.
It essentially involves using a panchromatic image to sharpen a multispectral image.
Bear with me.
Most multispectral satellite images are composed of various bands:
Red
Green
Blue
Near Infra-Red
In other words, these multispectral images accurately capture colours.
However, multispectral images have lower spatial resolutions, which are driven by limitations in satellite sensors.
Sensors can typically either capture a wide range of colours, or they can focus on a specific area to obtain more details (at the expense of colours).
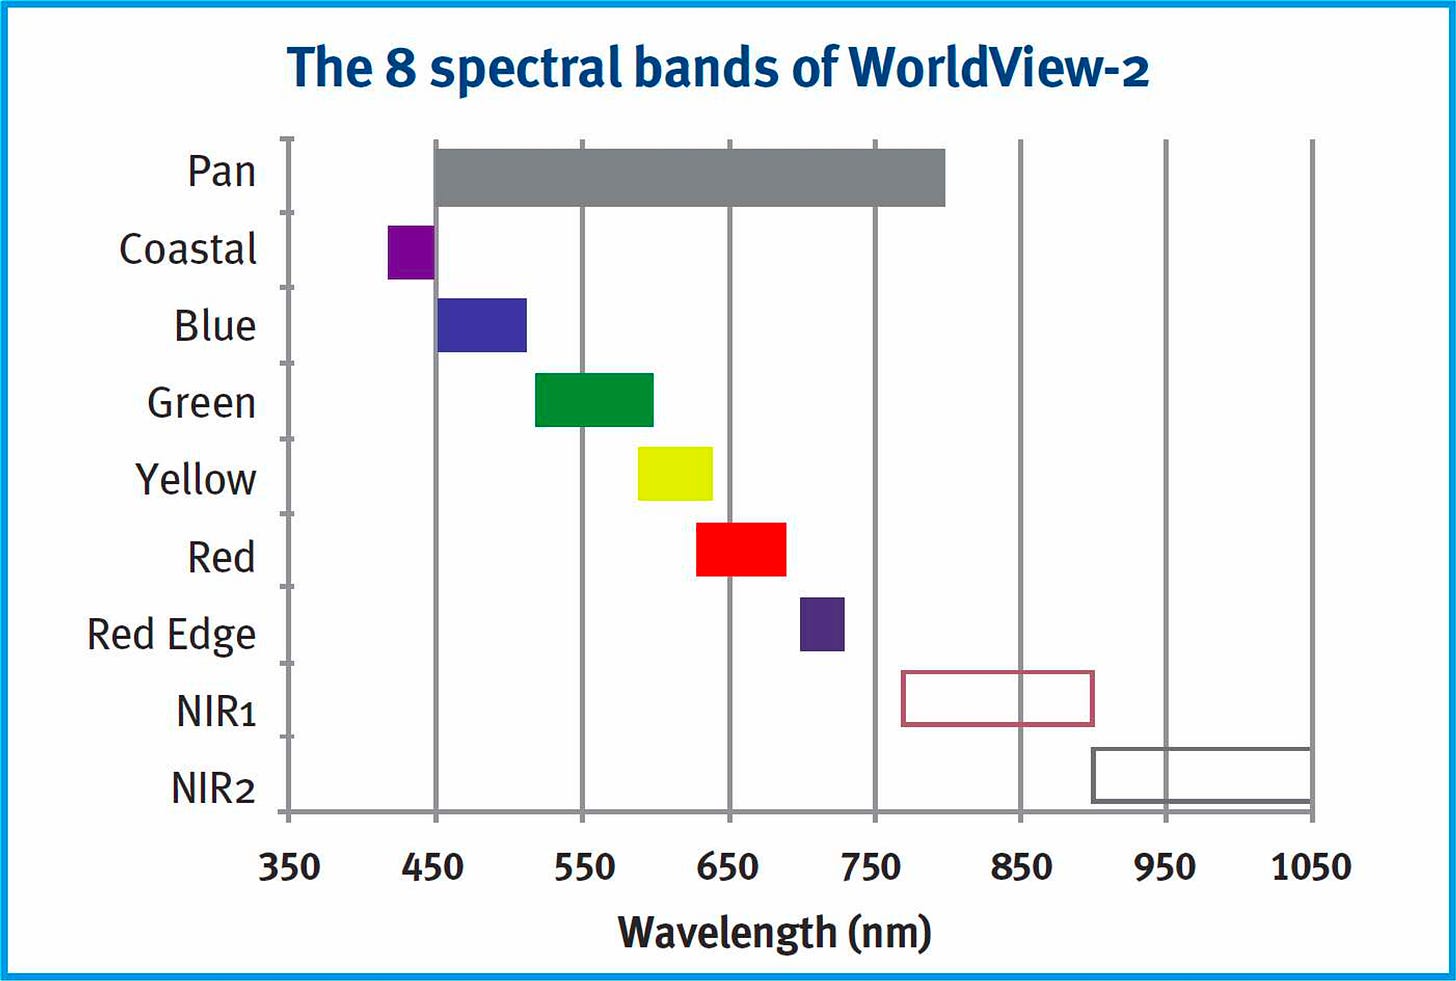
Satellites like Landsat-8 also capture panchromatic images. These are bands which have a single colour but capture more details.
In the image below, you can see here how the panchromatic wavelength doesn't capture a specific colour.
Instead, it captures a lot more information — leading to higher-resolution images.
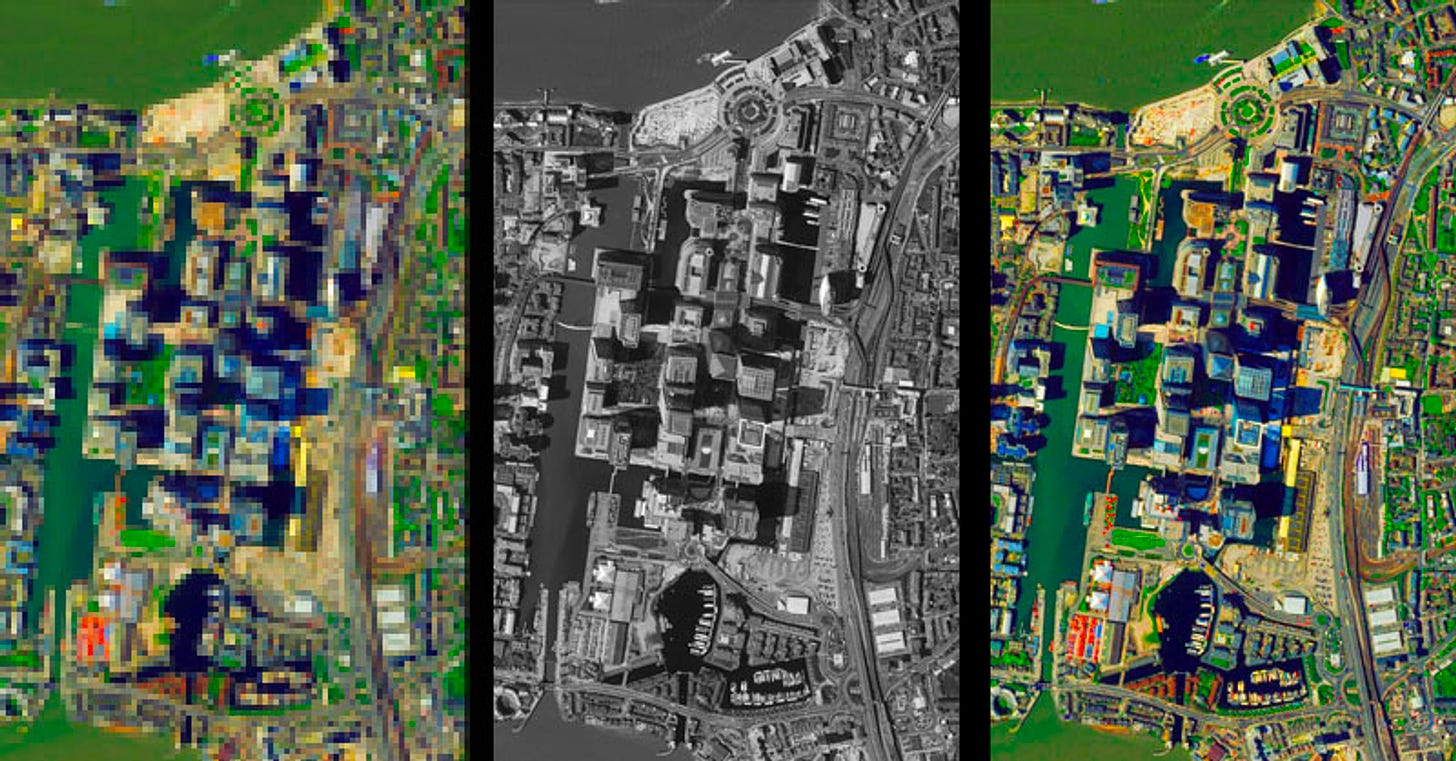
So pansharpening involves fusing multispectral images (which have a lower resolution), with panchromatic images (which have no colour but a higher resolution):
There are a few different pansharpening methods:
Brovey—multiplies each RGB band with panchromatic intensity
ESRI—uses a weighted multispectral average
Gram-Schmidt—creates a synthetic black and white image from RGB, then replaces it with the panchromatic image
But in any case, it’s relatively simplistic and in the case of Landsat-8, it can only increase the resolution from 30m to 15m. This is still a lower resolution than Sentinel-2 (10m).
2. Neural Networks
Neural networks incorporate a broad range of approaches to super-resolving images.
In other words, many different types of neural network models perform what’s known as Single Image Super-Resolution (SISR).
However, they all need to be trained on the pairs of low-resolution and high-resolution images to work properly.
Neural network variations in super-resolution include the following:
SRCNN (Super-Resolution Convolutional Neural Network)
Description: A foundational model for super-resolution that uses a convolutional neural network to upscale low-resolution images to higher resolutions. It's effective for enhancing satellite imagery by improving image clarity and detail.
Citation: ECCV 2014
ResNets (Residual Networks)
Description: Uses deep learning with skip connections to facilitate training deeper networks for super-resolution. It helps preserves details through many layers, which is important for the detail-rich demands of satellite imagery super-resolution.
Citation: arXiv 2015
VDSR (Very Deep Super Resolution)
Description: Uses deep learning to learn the difference between low and high-resolution images, focusing on upscaling with significant improvements in detail and clarity, suitable for enhancing satellite images.
Citation: IEEE 2016
RCAN (Residual Channel Attention Networks)
Description: Introduces a channel attention mechanism to focus on more informative features, significantly improving the quality of upscaled satellite images by enhancing detail and reducing artefacts.
Citation: ECCV 2018
DenseNets (Densely Connected Convolutional Networks)
Description: Features dense connections that ensure maximum information flow between layers in the network, beneficial for reconstructing high-quality super-resolved satellite imagery with enhanced detail retention.
Citation: arXiv 2016
Diffusion Models
Description: A newer approach using a process that starts with noise and iteratively refines this into detailed images. Features from low resolution images are extracted using transformer networks and CNNs, and are then used to guide the creation of super resolved images.
Citation: Remote Sensing 2023
3. Generative Adversarial Models (GANs)
GANs use neural networks, but given their popularity, I wanted to single them out as a separate category.
You’ve probably heard of GANs as the technology behind deep fakes.
While GANs are associated with creating 'fake' content, the term is a bit misleading in the context of super-resolving satellite images. In super-resolution, GANs are used not to fabricate imagery but to reconstruct missing details that align closely with reality.
How do GANs work?
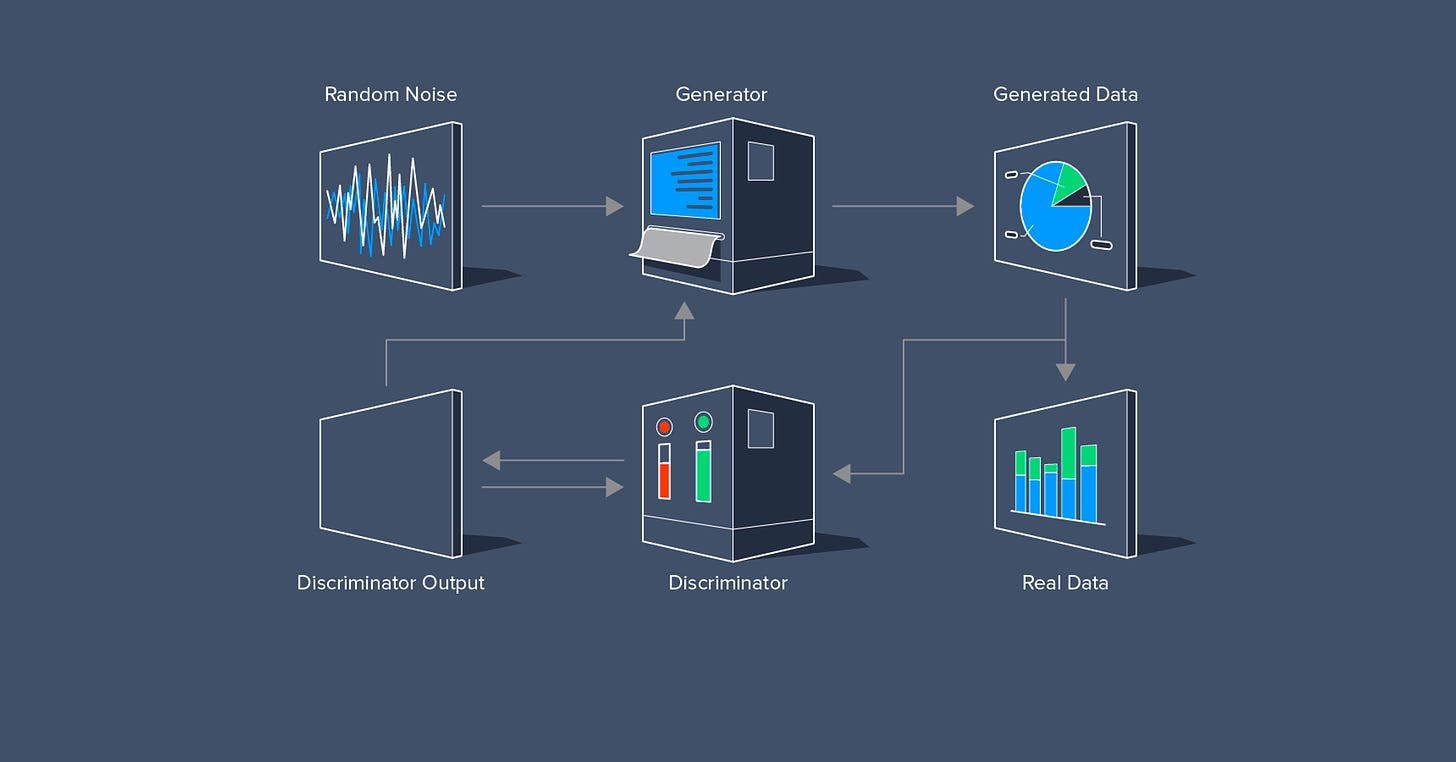
In a nutshell, GANs involve the use of two neural networks that contest with each other. One—the generator—takes random noise and generates an image. Then a second neural network—the discriminator—evaluates the authenticity of the data.
In other words, the generator's objective is to create an image indistinguishable from ground-truth images, essentially "fooling" the discriminator. The discriminator aims to accurately differentiate between genuine and generated data.
In the context of Super Resolution GANs (SRGANs), the generator takes a low-resolution image and adds more detail to it to create super-resolved images. The discriminator then distinguishes between the original high-resolution image and the super-resolved image. This process provides feedback to minimise the loss function so that each new image created by the generator is more accurate.
GANs for super-resolution
There are many variations on how GANs are implemented for super-resolution purposes. Here’s an overview of some of the main ones:
SRGAN
Description: SRGAN uses a generative network to upscale low-resolution images to higher resolutions, with a discriminator trained to differentiate between super-resolved and original high-resolution images.
Reference: "Photo-Realistic Single Image Super-Resolution Using a Generative Adversarial Network", Ledig et al. (2016). Link
ESRGAN
Description: An improved version of SRGAN, ESRGAN introduces modifications for better image quality through a residual-in-residual design and a new loss function.
Reference: "ESRGAN: Enhanced Super-Resolution Generative Adversarial Networks", Wang et al. (2018). Link
CycleGAN
Description: CycleGAN translates images from one domain to another without paired examples, useful for unsupervised learning tasks like super-resolution.
Reference: "Unpaired Image-to-Image Translation using Cycle-Consistent Adversarial Networks", Zhu et al. (2017). Link
ProGAN
Description: ProGAN improves training stability and image quality by progressively increasing the resolution of generated images during training.
Reference: "Progressive Growing of GANs for Improved Quality, Stability, and Variation", Karras et al. (2017). Link
RCAN
Description: Though primarily a CNN, when integrated with GAN frameworks, RCAN uses channel attention mechanisms for high-quality image upscaling.
Reference: "Image Super-Resolution Using Very Deep Residual Channel Attention Networks", Zhang et al. (2018). Link
SFT-GAN
Description: SFT-GAN introduces a spatial feature transform layer to adapt the upscaling process based on image context, enhancing texture realism.
Reference: "Recovering Realistic Texture in Image Super-resolution by Deep Spatial Feature Transform", Wang et al. (2018). Link
GANs with Perceptual Loss
Description: Perceptual loss functions minimise the difference in features between the super-resolved image and the original image. It assesses how closely the reconstructed image matches the perceptual qualities of the target image (e.g., textures, edges, and content arrangement).
Reference: "Perceptual Losses for Real-Time Style Transfer and Super-Resolution", Johnson et al. (2016). Link
Model calibration
The final element that impacts the accuracy of resolution models is model calibration. This is the process of refining a model.
Once a specific type of model (e.g. neural network, or GAN) is chosen, it's not ready to use straight out of the box. It requires calibration to tailor its performance to upscaling satellite imagery.
Model calibration involves several key steps, the most important of which are the loss function and hyperparameters.
The loss function acts as a kind of guide to help the model understand the difference between its current output and the high-resolution image we’re after. It's a measure of accuracy, with the goal being to minimise this loss during training. Choosing the right loss function is essential, as it impacts how well the model learns the nuances of satellite imagery (e.g. texture details and sharpness).
Hyperparameters, on the other hand, are the settings that define the model's architecture and learning process. These include learning rate, batch size, and the number of epochs over which the model is trained. Adjusting these parameters is a balancing act. If we set them too high, the model may learn too fast and miss important details. If we set them too low, the model might not learn enough or could take far too long to train.
The calibration process typically follows these steps:
Initial Setup: We start with default settings and a basic loss function to get a baseline performance.
Evaluation and Adjustment: Use a validation set of images to evaluate the model's performance. We look for areas where the model struggles, such as failing to capture certain details or textures.
Iterative Tuning: We adjust the hyperparameters and potentially the loss function based on the evaluation. This is an iterative process, which typically requires several rounds of adjustment and evaluation to hone in on the best settings.
Final Testing: Once the model's performance on the validation set stops improving, we do a final test on a separate set of images to ensure it generalises well to new data.
The bottom line here is that model calibration is a meticulous process that helps us to tailor a model to the specific task of super-resolving satellite images.
To summarise, there are three main things we need to think of when discussing the factors that impact the accuracy of super-resolved satellite images:
Input data
Model selection
Model calibration
How do we judge accuracy?
One thing that annoys me with some of the literature on super-resolution, is that the results are only presented visually. E.g. a low-resolution image is presented next to a high-resolution image.
But solely using this to judge accuracy is misleading.
There are so many unknowns with this:
what is the ground truth?
are these images in-sample or out-of-sample?
how do these images respond to differences in urban vs rural environments?
Instead, we need to pay more attention to metrics.
And while metrics have their own issues, they at least provide a bit more information (provided we know additional factors like whether it’s measuring out-of-sample performance).
These are some of the core metrics we should be looking at:
Peak Signal-to-Noise Ratio (PSNR)
PSNR is a widely used metric for measuring the quality of super-resolved images compared to their original high-resolution counterparts. It calculates the ratio between the maximum possible power of a signal (the pixel values of an image) and the power of distorting noise. Higher PSNR values indicate better image quality.
Structural Similarity Index (SSIM)
SSIM measures the similarity between two images in terms of luminance, contrast, and structure, providing a more holistic view of image quality than pixel-level differences alone. Values range from -1 to 1, with 1 indicating perfect similarity.
Root Mean Squared Error (RMSE)
RMSE calculates the differences between the super-resolved and original high-resolution images, with lower values indicating better performance and higher image fidelity.
Universal Quality Index (UQI) and Multi-Scale Structural Similarity (MS-SSIM)
These metrics build on SSIM by considering changes in viewing conditions, such as resolution or viewing distance, useful for evaluating images observed at various scales.
Feature Similarity Index (FSIM)
FSIM measures the similarity between two images based on their low-level features, such as edges and textures, focusing on elements crucial for visual similarity.
Visual Information Fidelity (VIF)
VIF assesses image quality by modelling the natural image statistics and their changes due to distortions, aligning with how the human visual system perceives quality.
Edge Fidelity
Edge fidelity metrics evaluate the preservation of boundaries and edges within the image, which is important for distinguishing different objects or landforms in the image.
Why super-resolution isn’t a panacea
We now have a pretty solid foundation of what factors impact the quality of super-resolution models. This equips us with the ability to answer the question of how accurate super-resolution can be.
However, there’s a final element which we need to mention. Why do we want to use super-resolved images?
The utility of super-resolved images depends on your use case. It’s not a one-size-fits-all approach.
In a review article by Wang et al. (2022), they found that despite all of the developments in the field of super-resolution, there are many areas where super-resolution faces limitations:
Diverse Targets and Complex Types: The vast number of ‘targets’ (e.g. different types of vegetation, urban areas, water bodies, etc.) and their complexities add a layer of difficulty for super-resolution models. These models need to enhance images accurately across all these diverse elements, which they sometimes struggle to do.
Influence of External Environments: Things like lighting and atmospheric conditions can significantly impact the quality of satellite data. Super-resolution models therefore have to overcome these challenges to improve image quality effectively.
Adaptation to Different Scales and Scenes: Remote sensing images cover areas with varying object sizes and scenes at different scales. Super-resolution models struggle to adapt to these variations, impacting their ability to consistently produce high-quality enhancements across different images.
Limitations in resolution enhancement: No matter how good a model is, there will always be a threshold to enhancing the resolution, after which the results significantly lose reliability. For example, if we wanted to increase Sentinel-2 images from 10m to 10cm. This would clearly be a problem.
So taking all of these things together, If we’re trying to do something like use super-resolution data to count the number of tiles on a rooftop, this might be challenging to do because this requires too much detail.
Similarly, trying to identify and track the movement of specific small animals, like birds or rodents, in a dense forest environment would face several challenges given the complex environment and limitations in resolution enhancement.
The takeaway here is that we need to be clear that our specific use cases for super-resolved images don’t align with their inherent limitations.
Summing up
Super-resolution is a promising research area, which will help us overcome challenges around affording high-resolution images.
I really think we’ll increasingly use super-resolved images to do a first pass of an analysis. If the results are promising, we can then make a more informed decision about whether to invest a significant amount of resources into purchasing high-resolution images (to improve the accuracy of the analysis).
However, super-resolution isn’t a panacea. The accuracy and quality of super-resolution models are driven by the quality of the input data, the models selected, and how these models are calibrated. We also need to be sure that our use case for super-resolved images will not be hindered by the inherent limitations of these approaches.
But if we keep these factors in mind, we’ll be in a good place to start using these tools on more of a day-to-day basis.
Working on super-resolution?
If you have experience in either super-resolution or computer vision, I’d love to speak with you. Please drop me a message by hitting reply to this email, or by DMing me on X.
Sponsor
This newsletter is sponsored by Ekko Graphics, a UK-based design studio that builds websites and geospatial platforms. I’ve worked with them previously at the World Bank, and they’ve built websites and done brand design for two of my former companies, 505 Economics and Lanterne. They’re offering a free consulting call if you’re looking to set up a personal website or develop a geospatial platform.


